| Right Margin on Chart n % |
Sets the distance between the last period and the right border of the graph's pane |
| Upper / Lower Margin on Chart n % |
Sets the amount of free space between the upper/lower borders in % |
| Snapshot Template |
If enabled, the selected template will be used to create a snapshot of each closed trade. You can select tab chart group templates from the list (if you have already created them). If you do not select a template, then only the chart (time frame) in which the trade takes place will be saved as a picture. The stored snapshots are located here: AgenaTrader/TradeEscort/Files/Date/ChartImages/Trade. In order to change the appearance of the snapshot which is taken after every trade, choose a Chart Group Template of either a List Chart Group or Tab Chart Group. Learn more about how to create templates Chart Group: Templates |
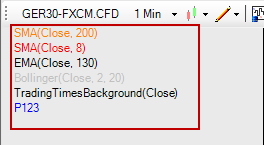
| Show Indicator Information |
Enables or disables the option to display frequently used indicators when you hover the mouse cursor over the chart.
|
| Use ChartTraderBar-Boxes |
If this is enabled: the entry line will be displayed as a box
If this is disabled: the entry line will be displayed as a line
|
| Manipulate Confirmed Order Bars |
If this is disabled then only unconfirmed order bars can be ajusted:

If this is enabled then you will be able to adjust confirmed order bars:

|
| Autoscale Chart Trader Bars |
Enabling this option scales the chart so that all chart trader bars (entry/stops/target) are visible. Let's assume that you run a trade using the day chart and then switch to the 5-minute chart. This may lead to orders on the 5-minute chart being too far away from each other, so that in order to display all orders the chart must be extremely compacted. So, check this box if you want all order bars to be shown inside the chart (autoscale). If order bars may also be located outside the chart, do not select this option. |
| Autoscale Chart Trader Markers |
Enabling this option scales the chart so that all chart trader markers are visible. |
| Link Chartgroups to Static Instrument Lists |
If a value is added/deleted inside a LCG/TCG, this will also be reflected in your static instrument lists and vice versa. |
| Print white chart background |
If checked, charts will be printed with a white background. |
| Remember Price Scale |
If checked, then current zoom settings will be applied to all instruments. |
| Show Info |
If checked, the instrument information will be displayed on each chart without using the Info indicator. If this information shall only be displayed for specific chart the info indicator can still be used. |
| Show Spread Lines on Quick Trader |
If activated the Quick Trader Bar will show Spread Lines. |
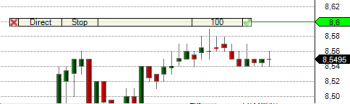
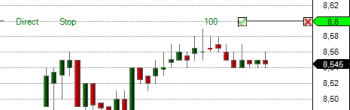
| Show Type of Data (Directly requested from datafeed of additionally process by AT) |
If activated the Chart will display the information if a time frame is directly received from the data feed or AgenaTrader needs to process the time frame. Direct Charts will be loaded faster. |
| Broker/Datafeed indicator |
If activated the Chart will display Broker/Datafeed connected status indicators. Details on page Navigating a chart |