


Trading Overview
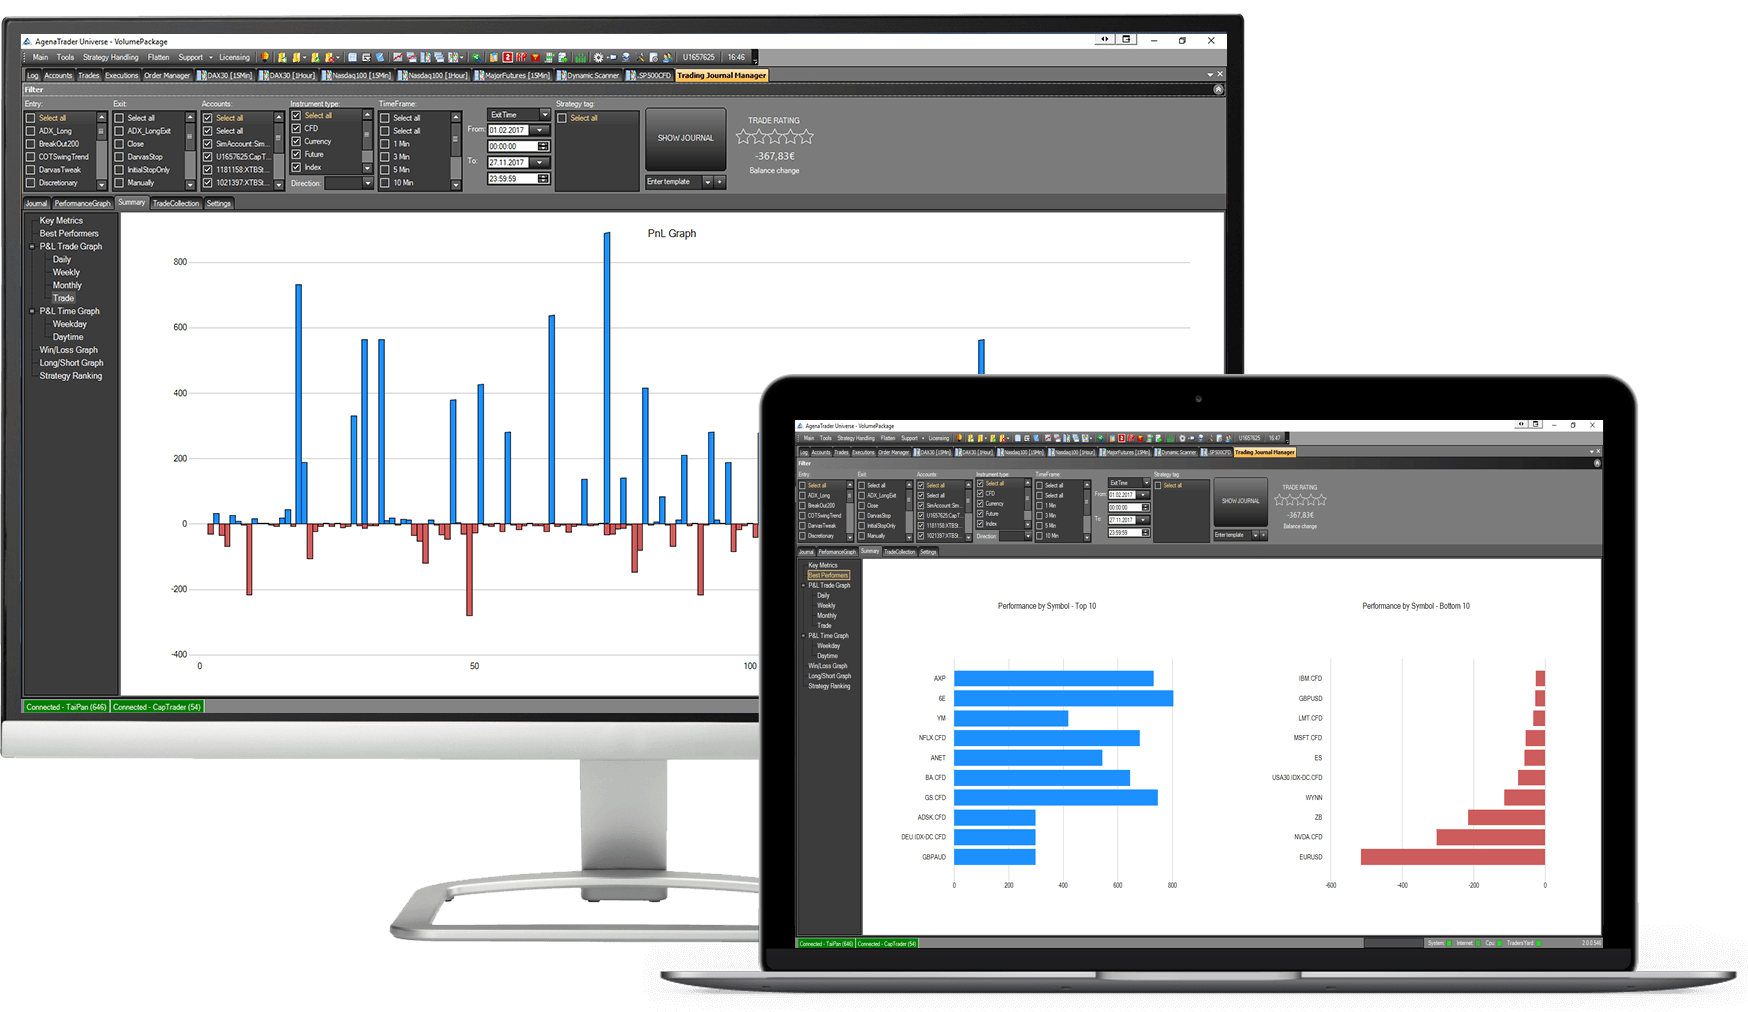
AgenaTrader records each trade and keeps an automated trading journal. This enables you to clearly understand and evaluate trading behavior.


With our Trading Journal PRO, you receive additional professional features for your trading diary. Obtain new, extremely valuable insights and analyses of your trading with the most sophisticated reports and get statistics about:
AgenaTrader records each trade and keeps an automated trading journal. This enables you to clearly understand and evaluate trading behavior.
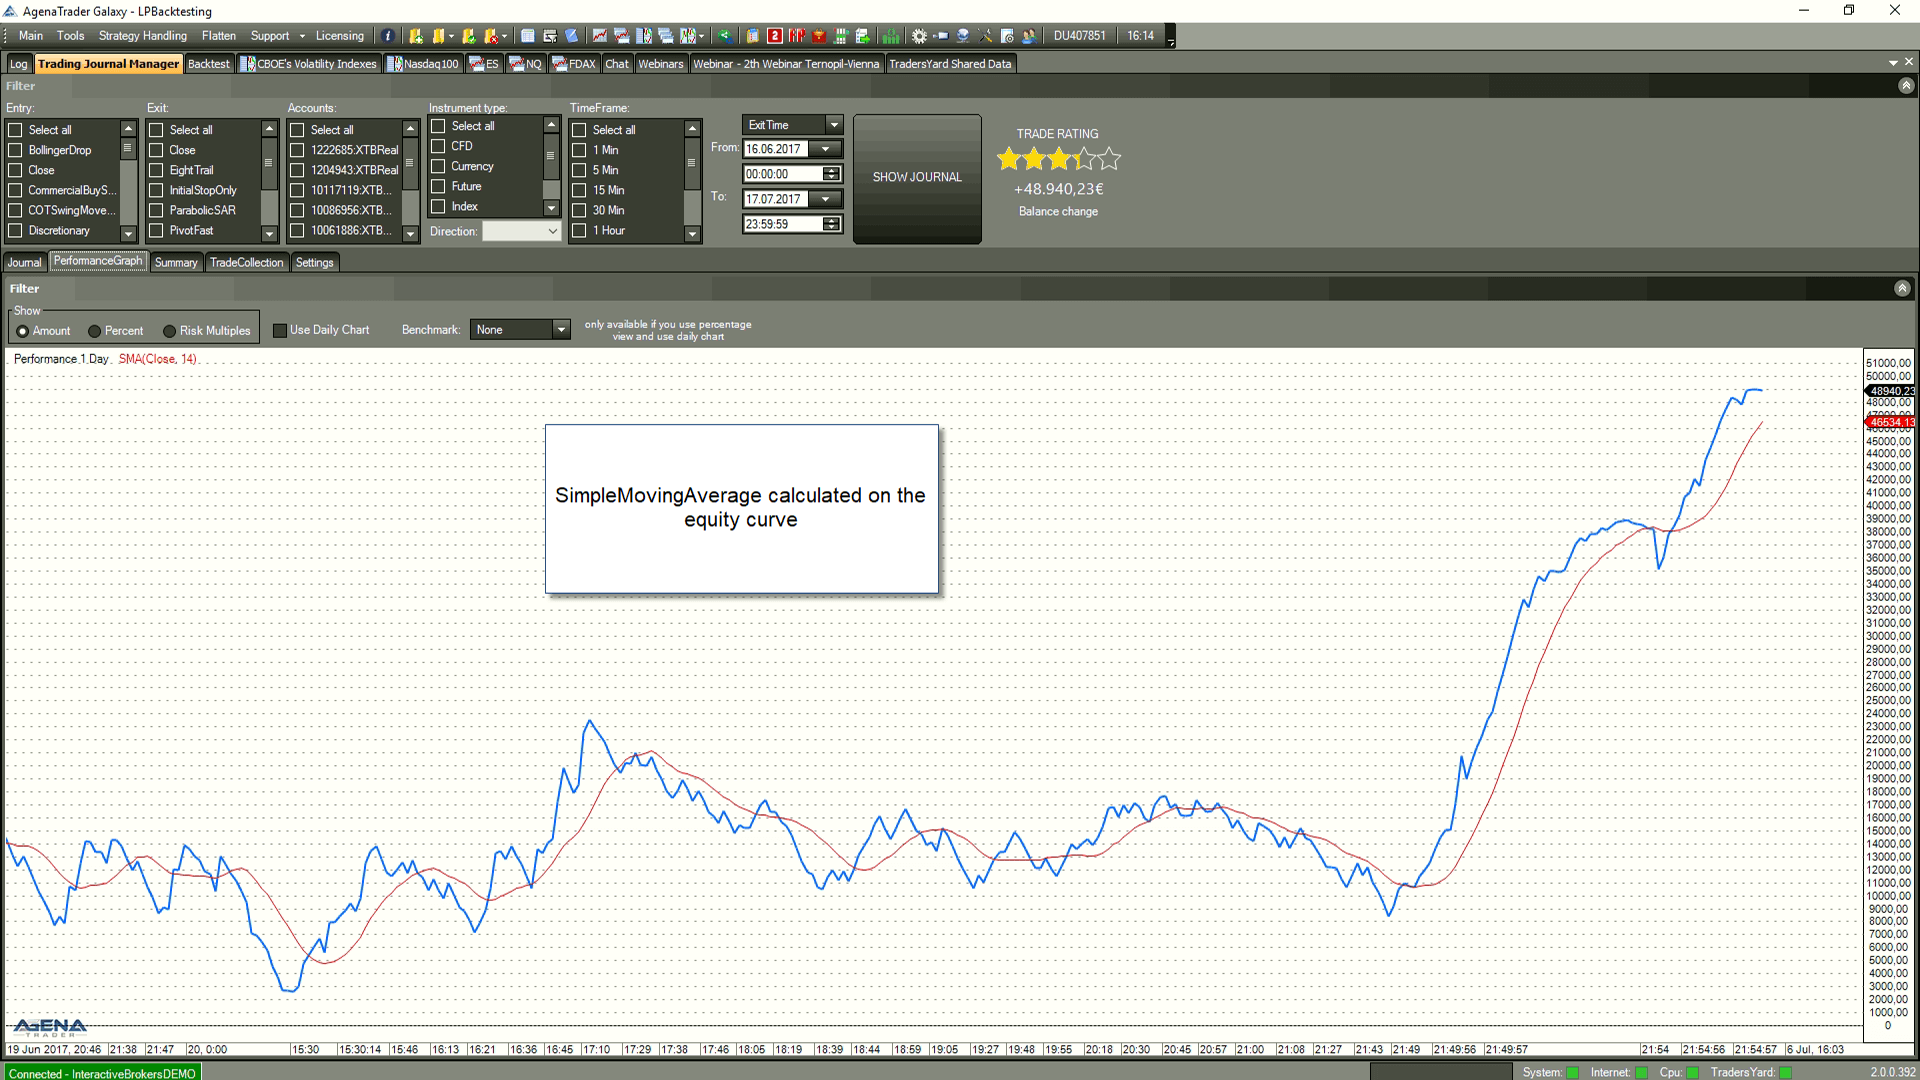
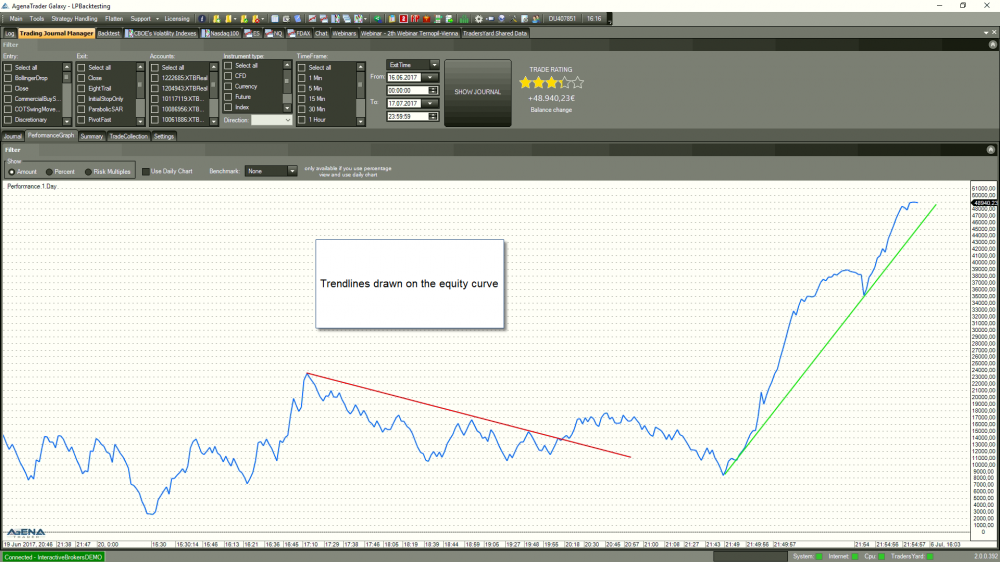
In the new TradingJournal, you can load any indicator to your equity curve, from which you can draw new conclusions, e.g. whether your equity curve is currently below the average or above it.

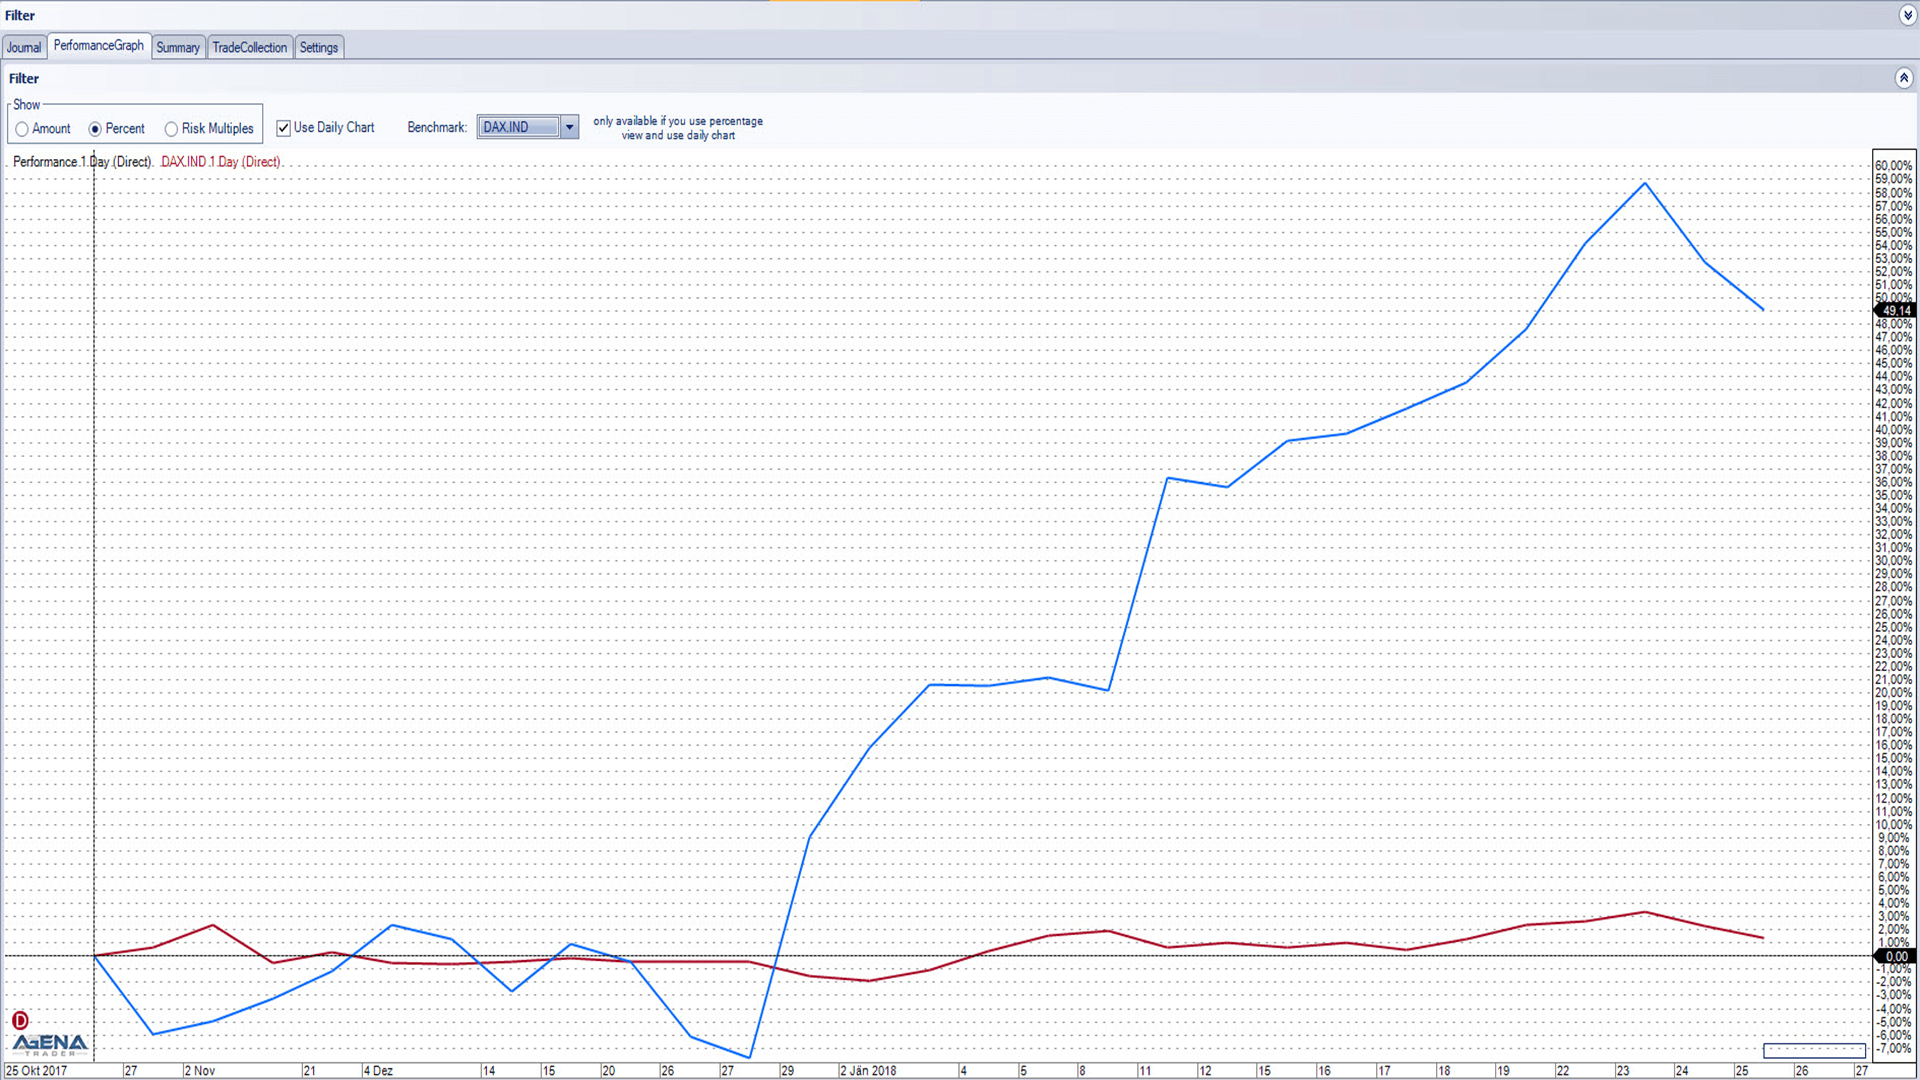
Just like in a normal chart, you can also use all possible drawing objects in the Performance Graph.
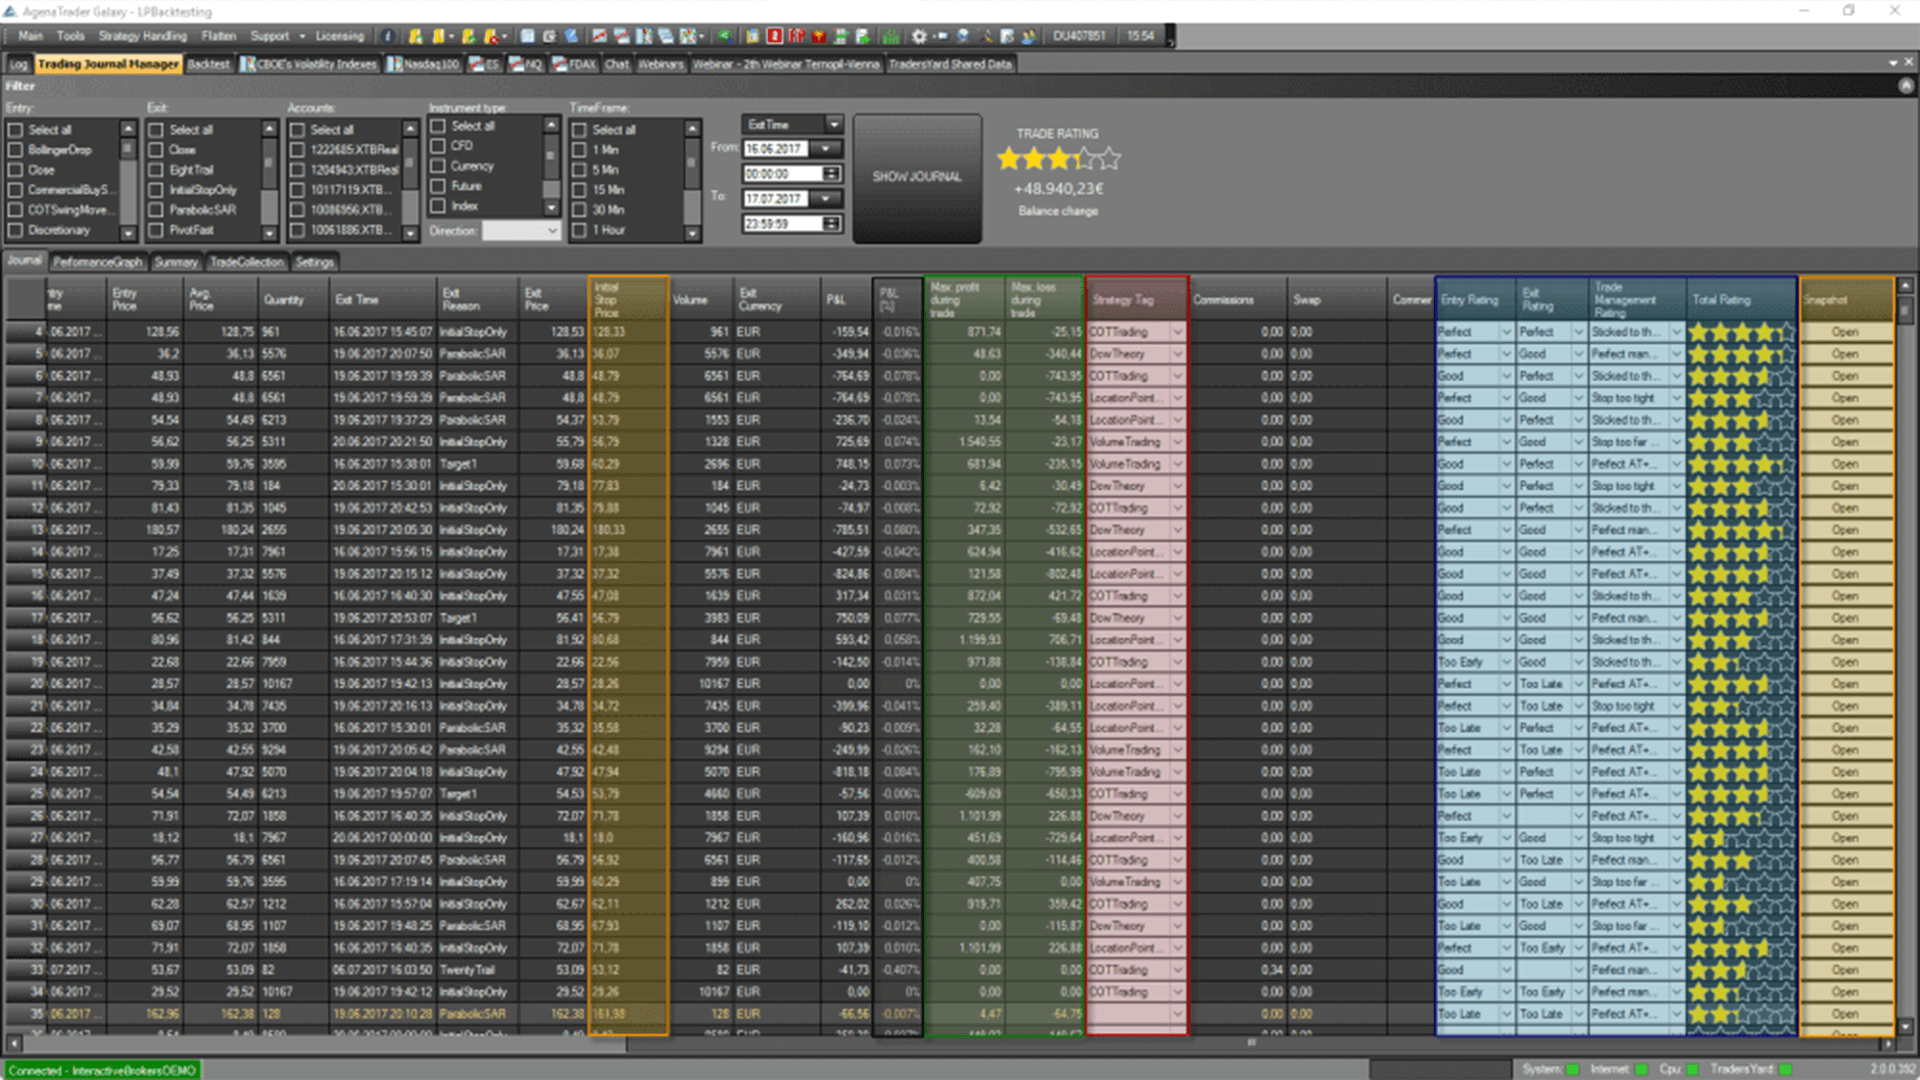
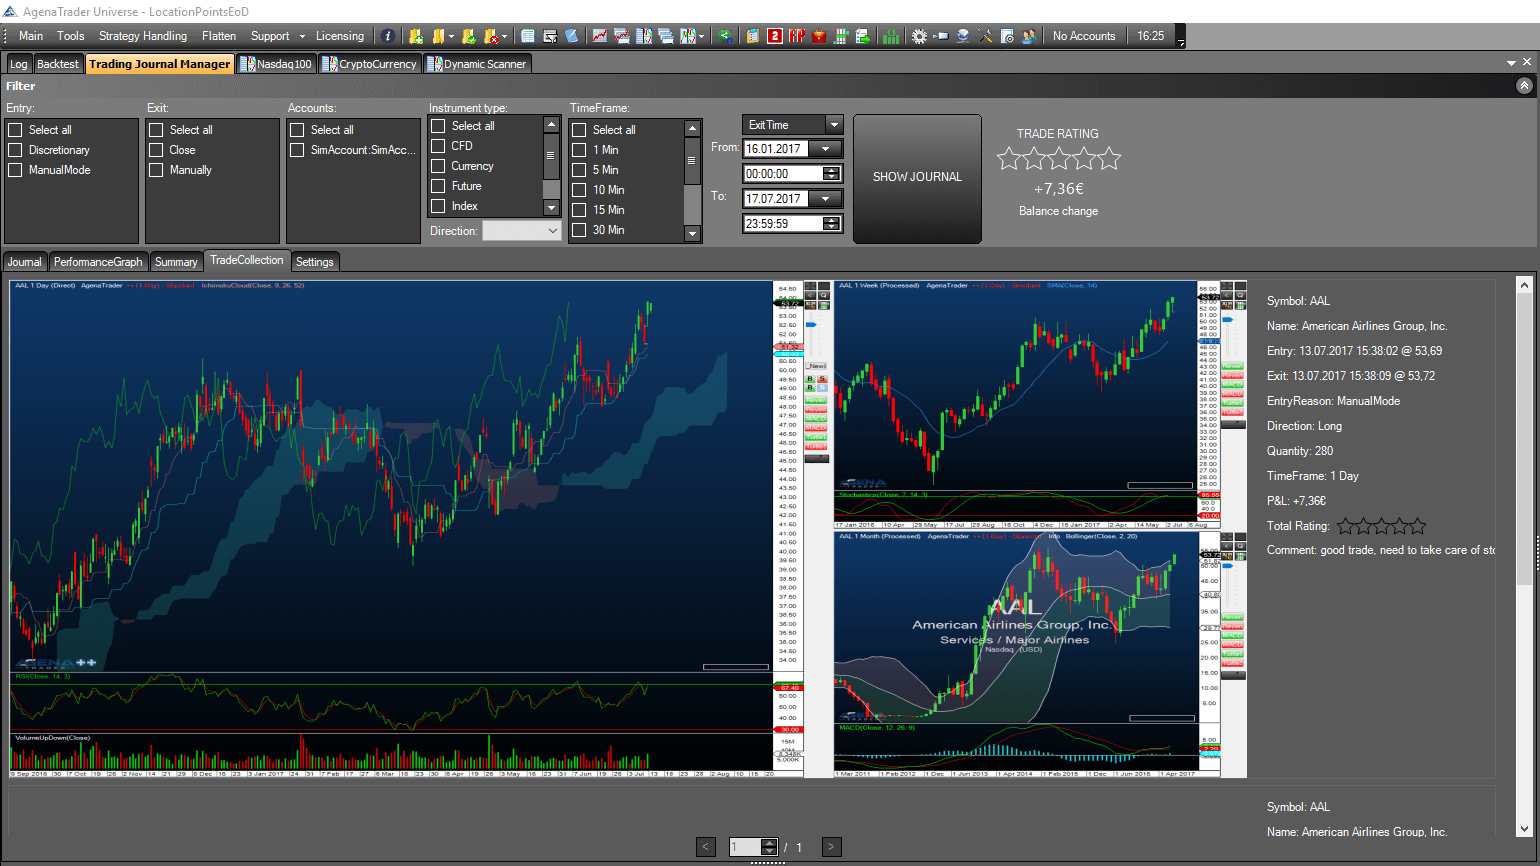
The TradeCollection provides a comprehensive overview of your trades, including automatic screenshots, important trade information, synchronized comments, and self-assigned TotalRatings, facilitating post-trade analysis and learning for traders of all levels.
“When using ‘Percent’ display and ‘Use daily chart,’ activate the Benchmark function to compare your performance to global indices with daily percentage changes, accessible by clicking in the chart.”
