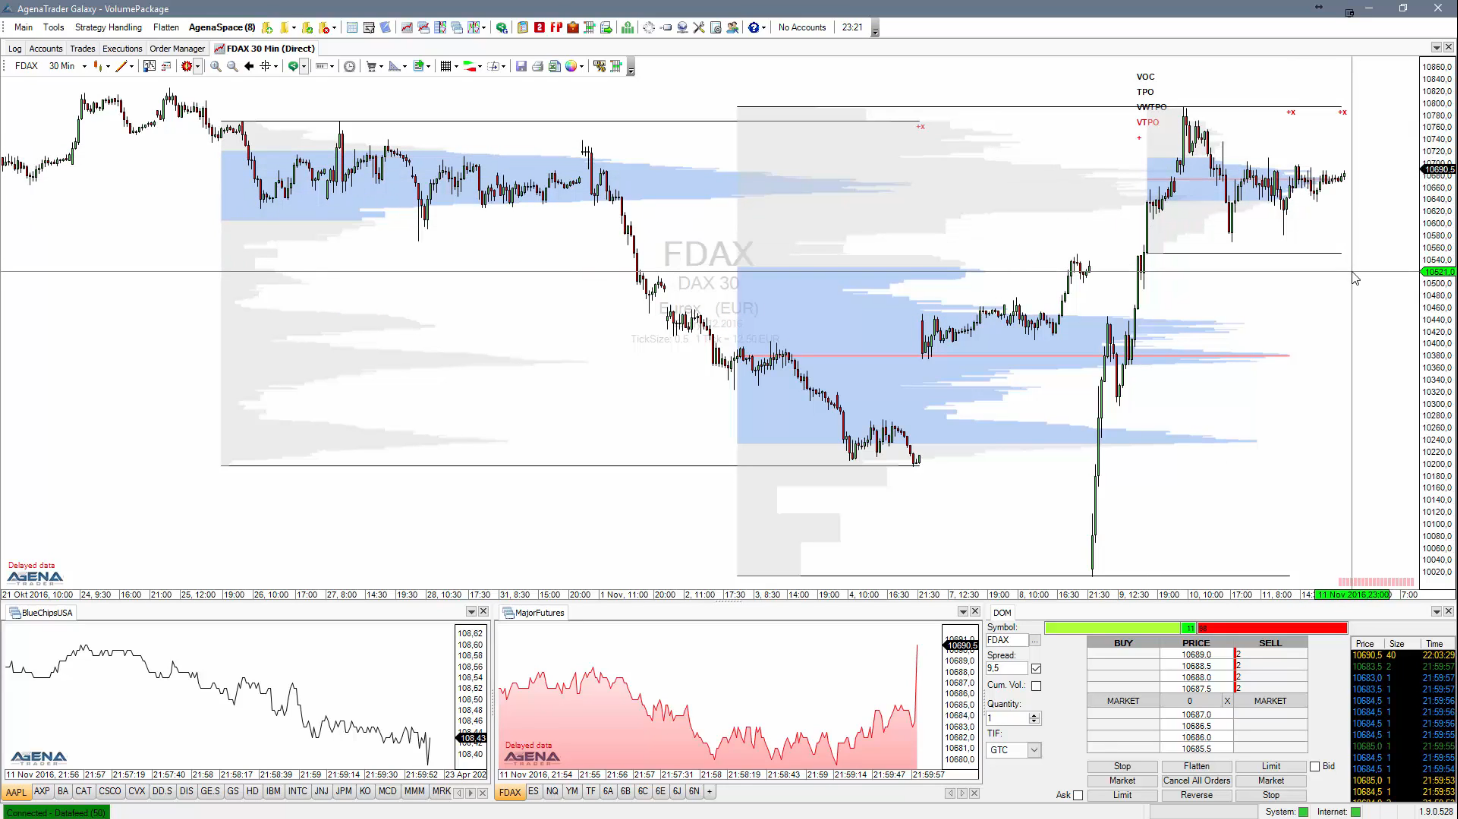

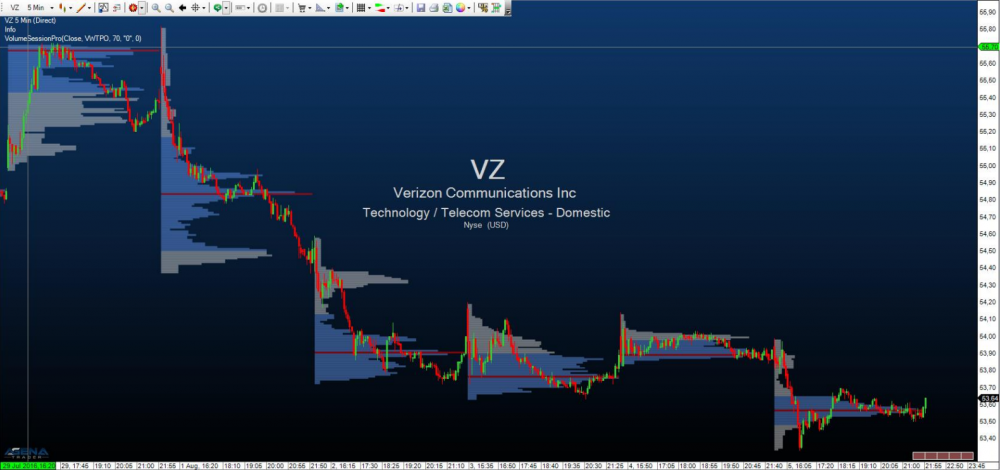
Volume Session Pro
This indicator is equivalent to the well-known VolumeProfile indicator with a display for a specific time span (session).
You can determine the start time and the length of a session however you wish.


Volume Trading AddOn is comprised of 12 Indicators and 8 Signals, as well as a fully setup Volume-Workspace.
Included indicators in this AddOn:
In addition, you get the following predefined signals: Long No Supply, Long Stopping Volume, Long Testbar, Long TwoBar Reversal, Short Up-Thrust, Short Hidden Up-Thrust, Short No Demand, Short TwoBar Reversal
This indicator is equivalent to the well-known VolumeProfile indicator with a display for a specific time span (session).
You can determine the start time and the length of a session however you wish.
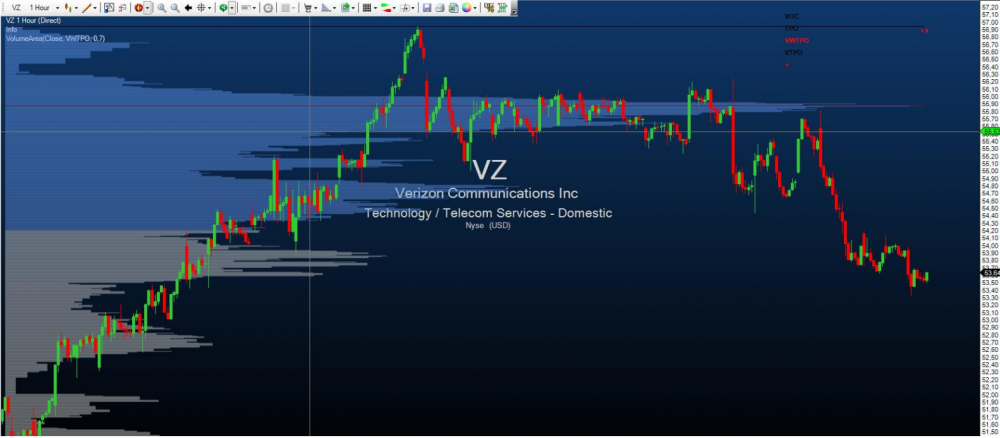
Similarly, with this indicator you can also have your own volume profiles displayed.
Here you can now determine the start and end time completely freely by clicking on your desired position
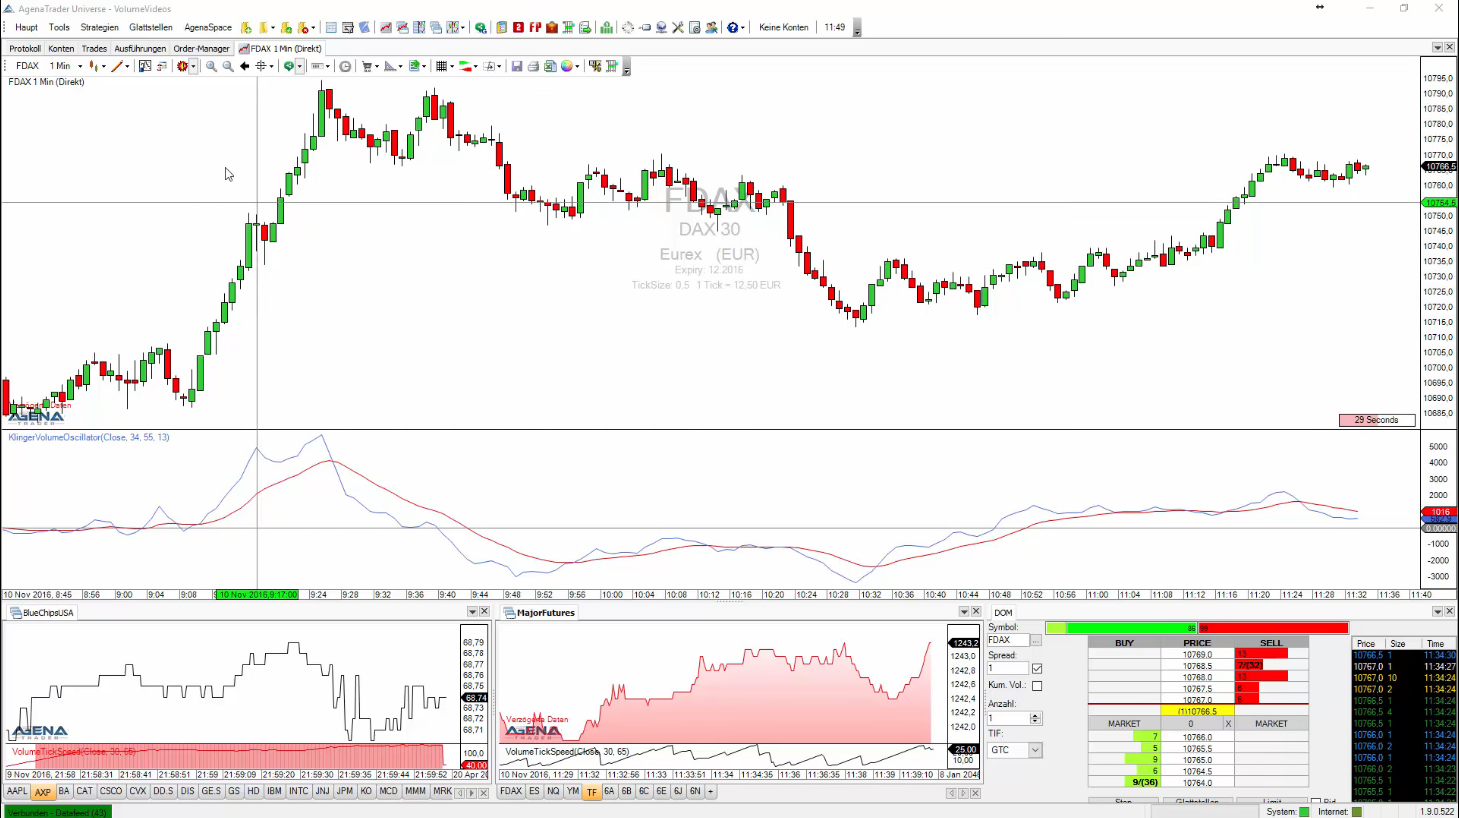
Is a technical indicator to determine long-term trends of the money flow. At the same time,
The indicator is sensitive enough to also identify short-term fluctuations.
Volume that is higher than the highest Keltner channel line can be interpreted as extremely high volume that shows that huge numbers of trades.
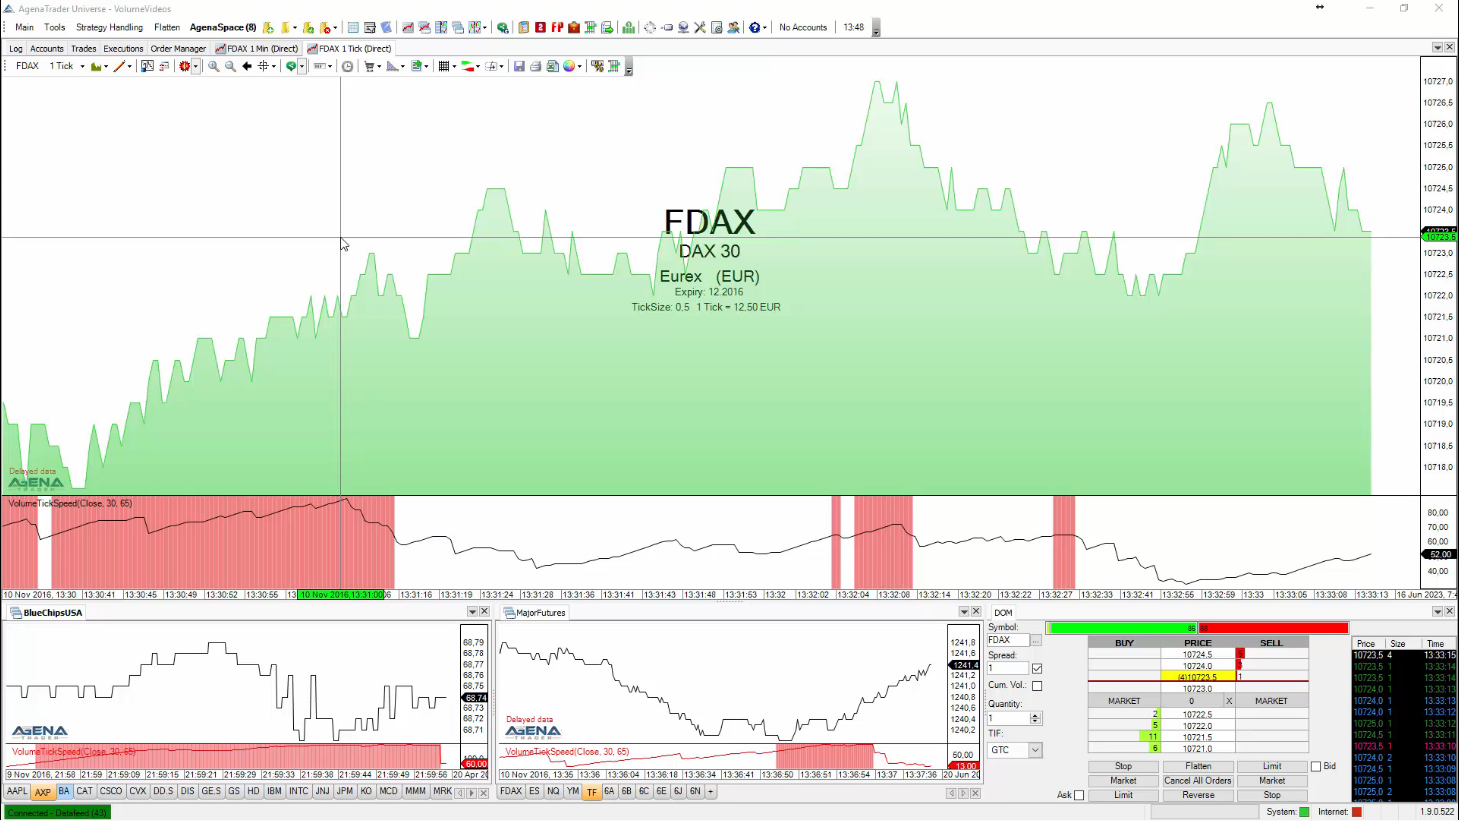
Is a great tool to determine very high or very low volume in comparison to past periods.
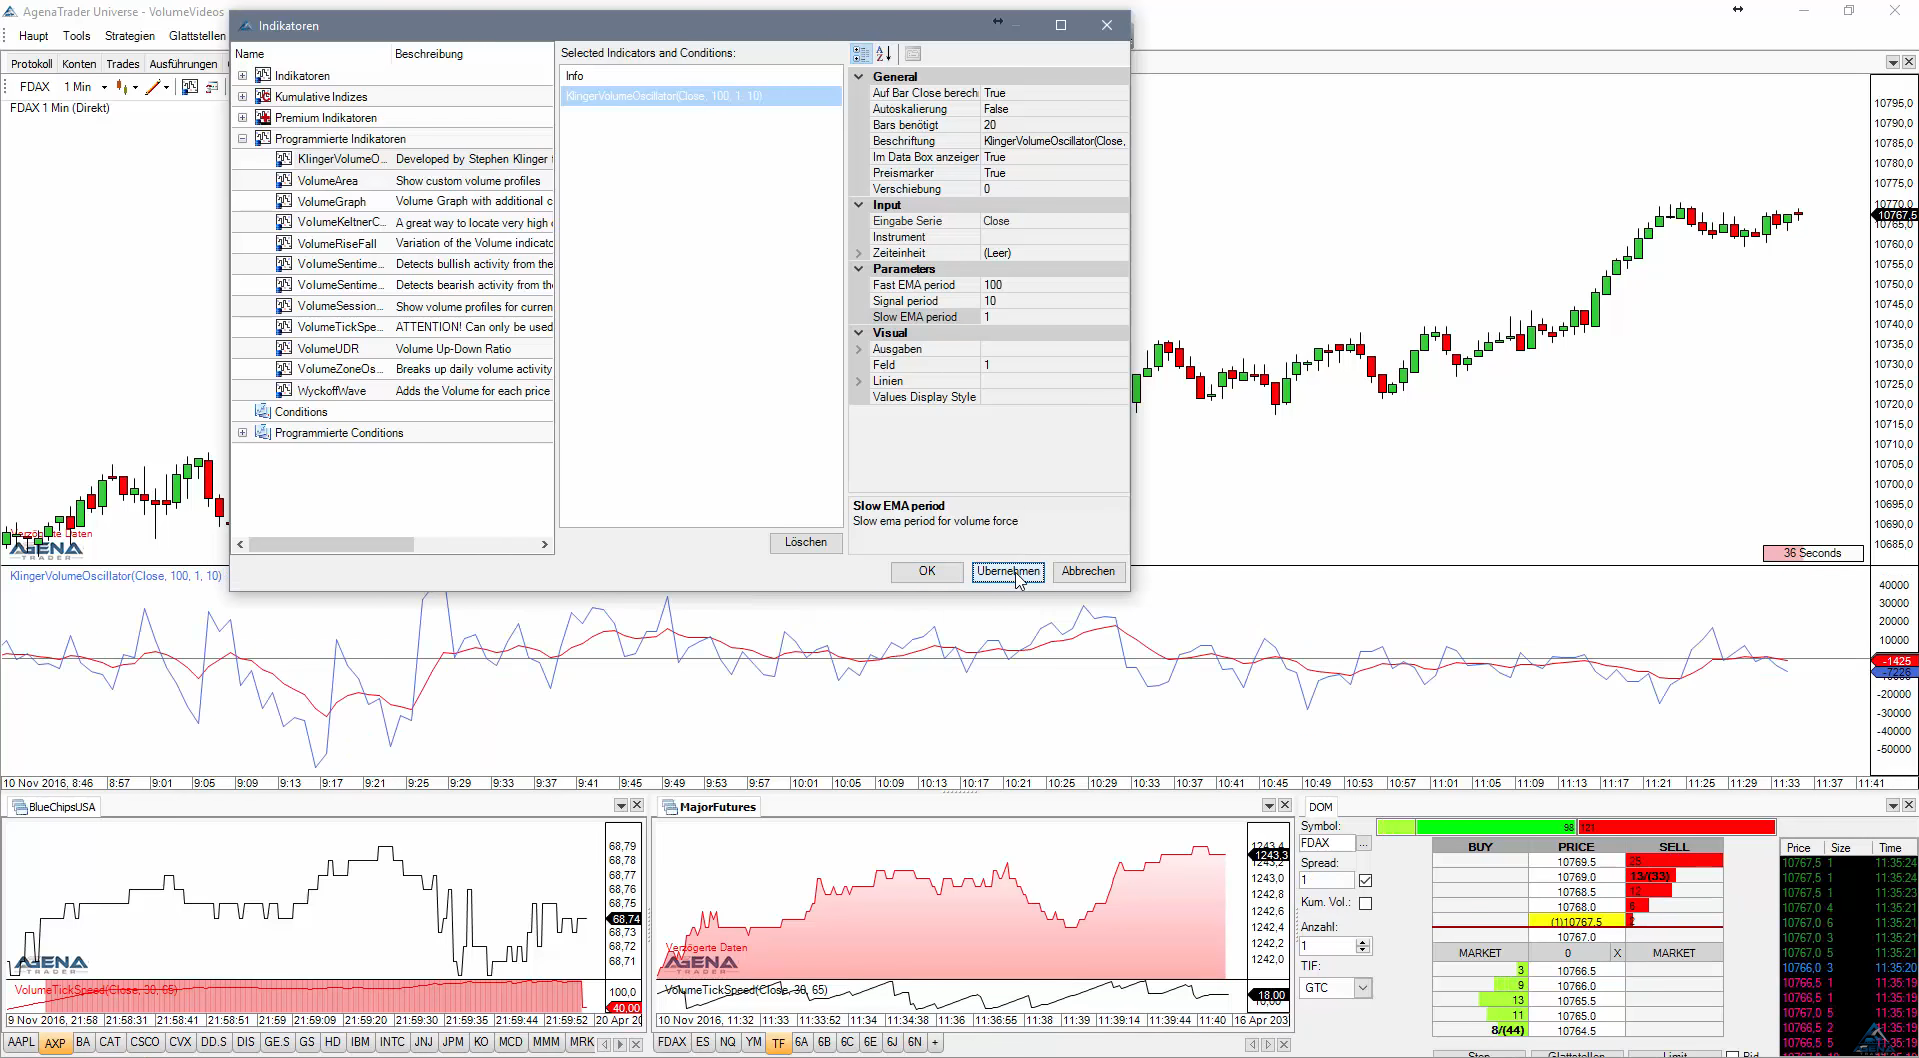
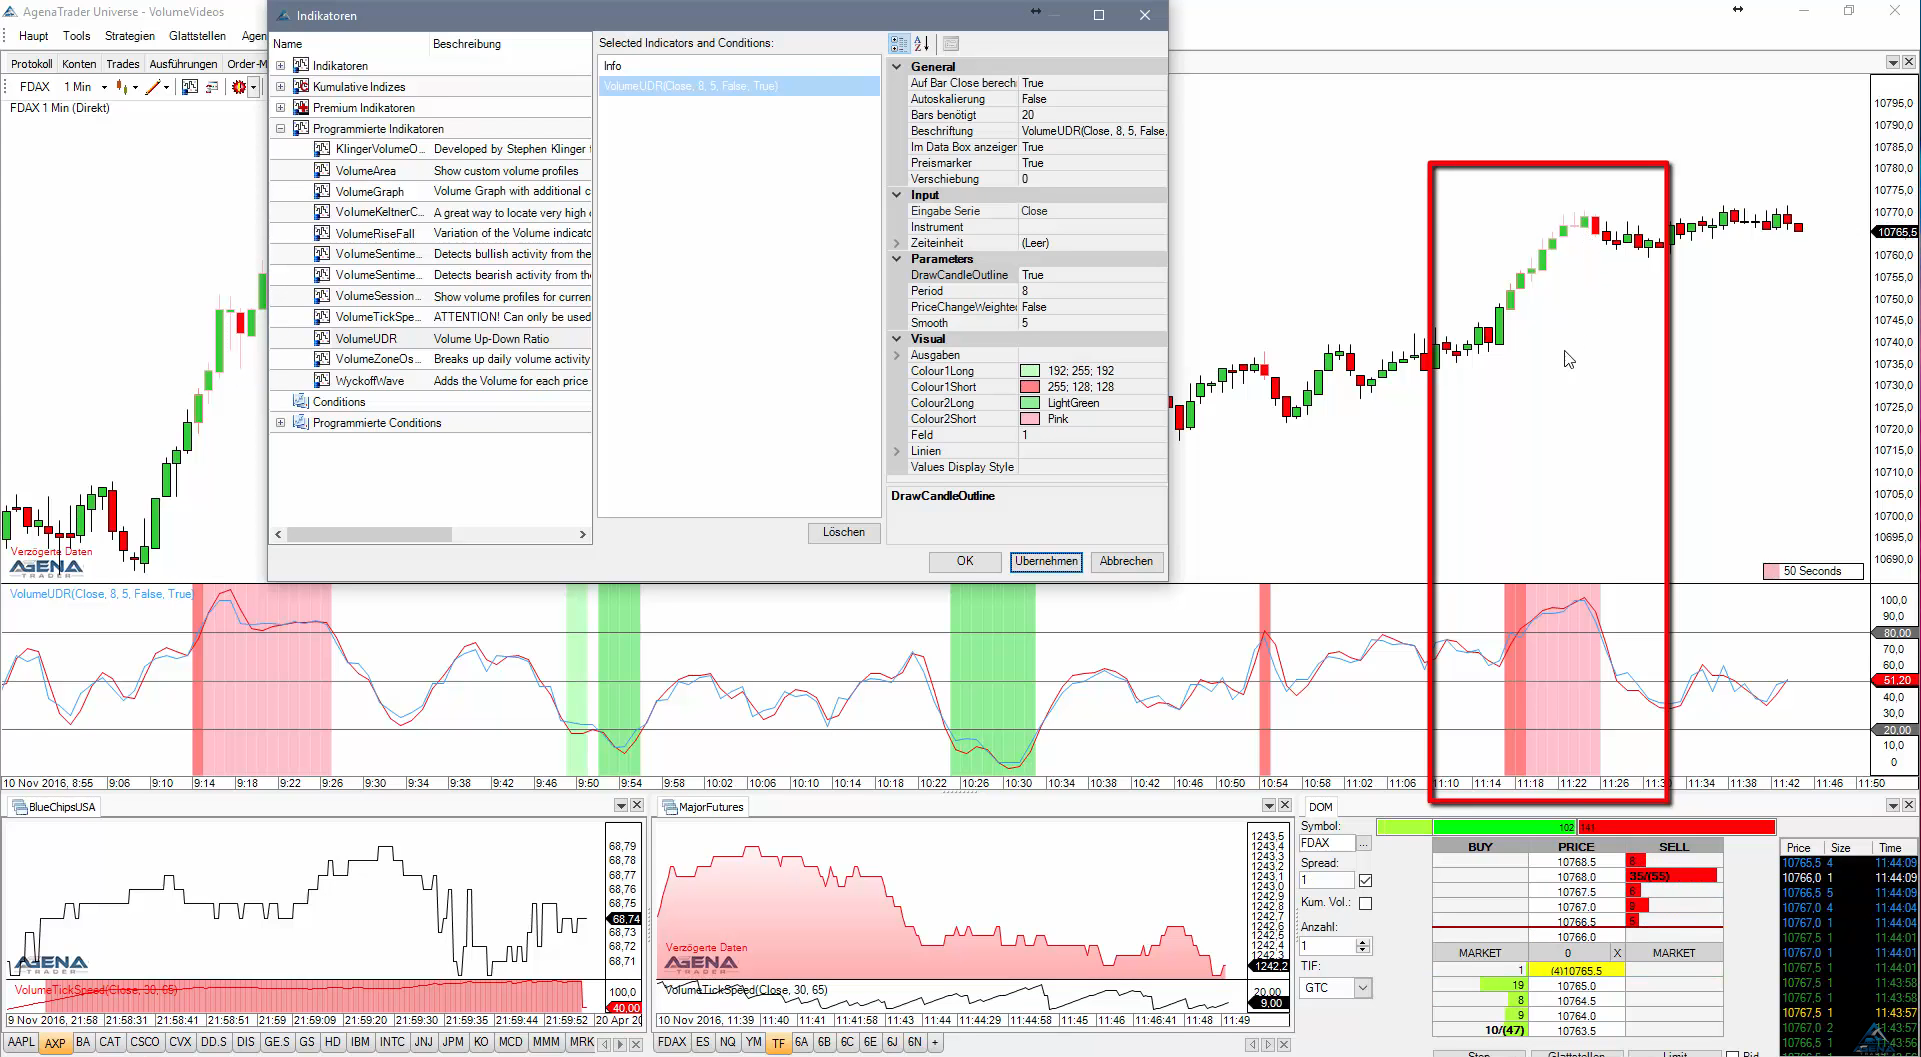
The VolumeUpDownRatio is the relationship between UpVolume and DownVolume, displayed as an oscillator
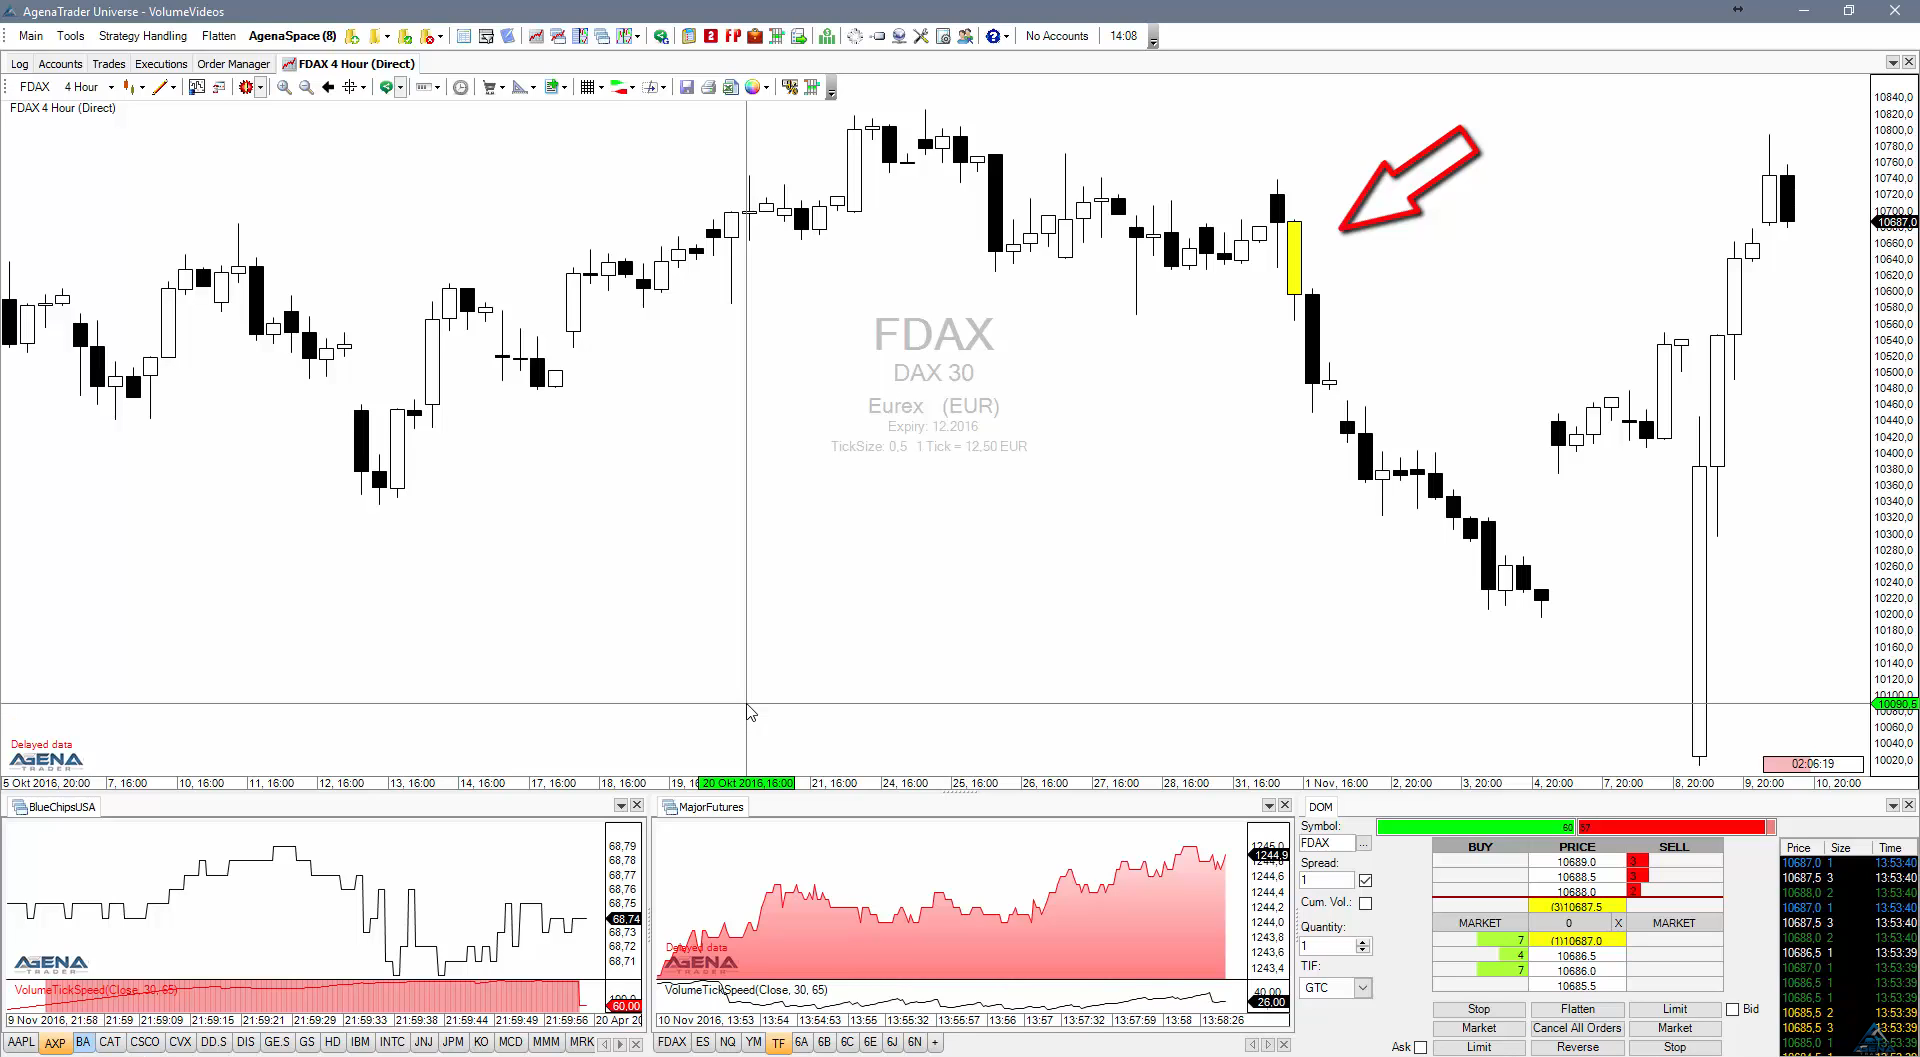
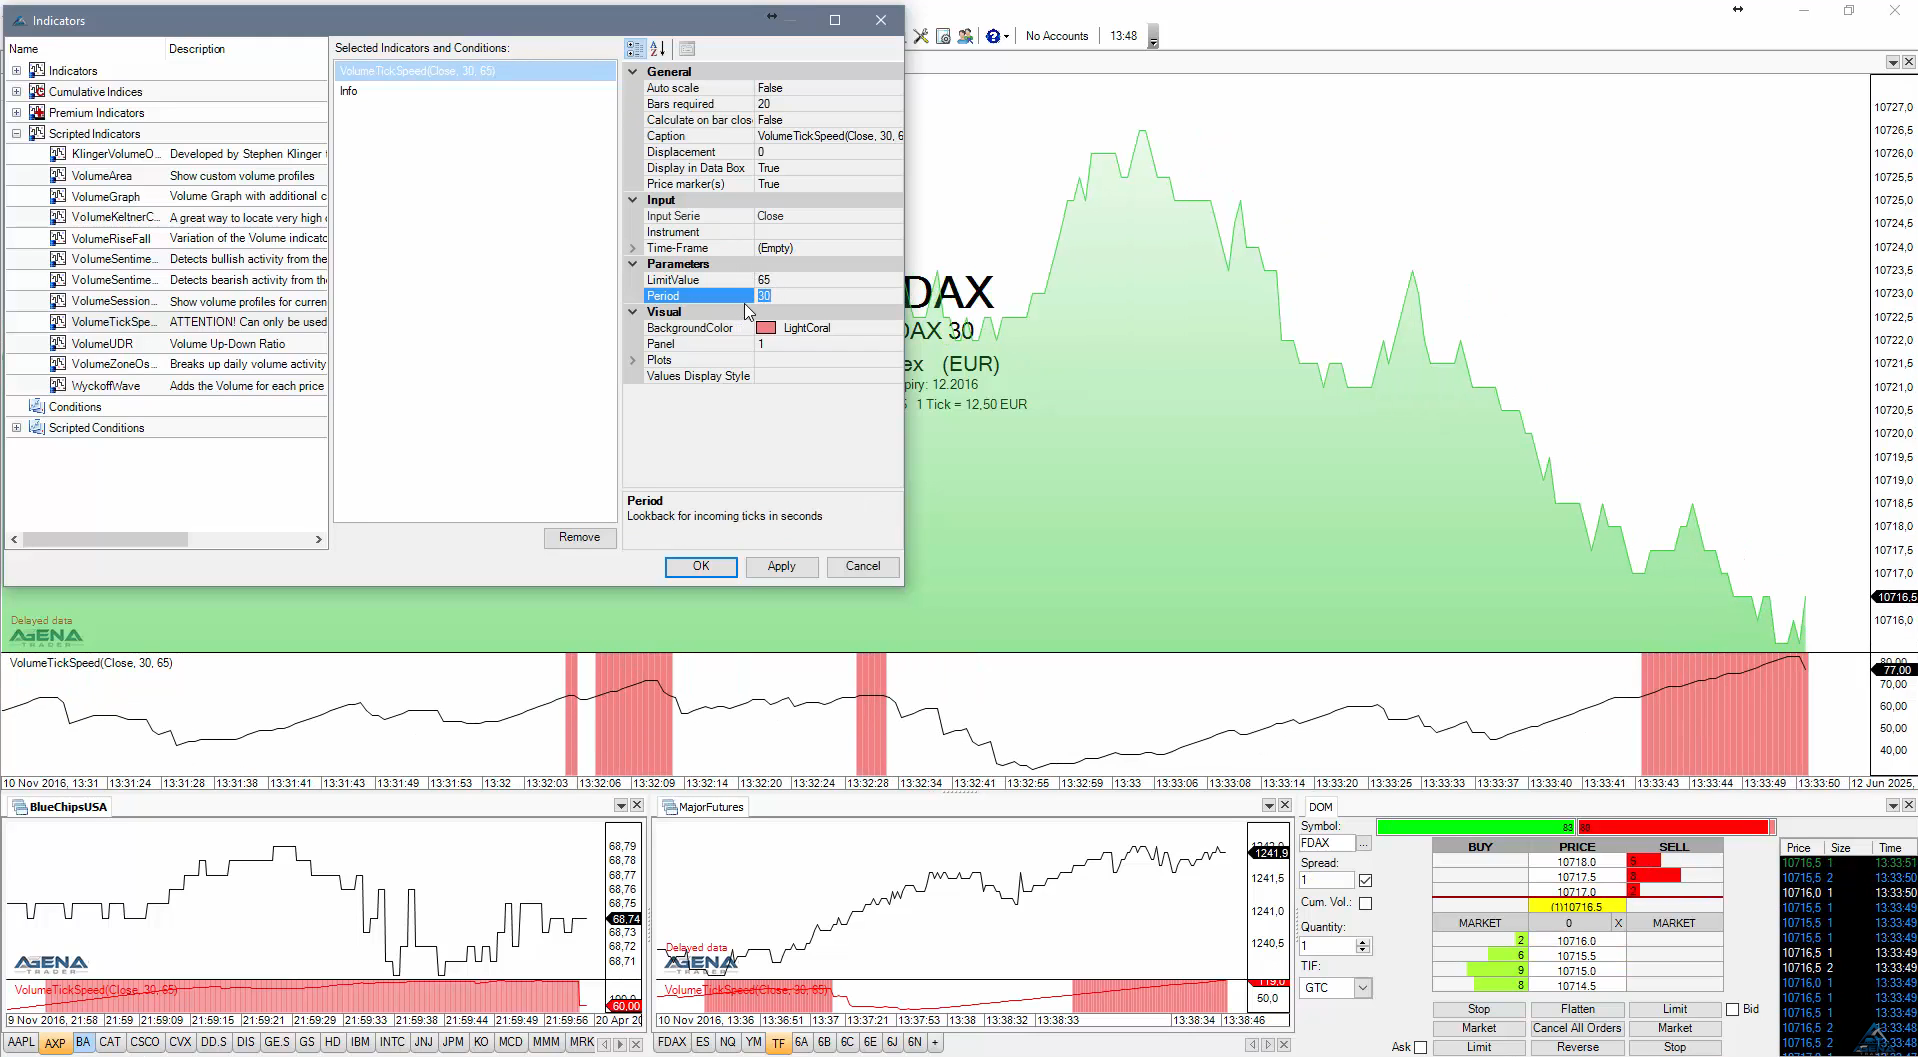
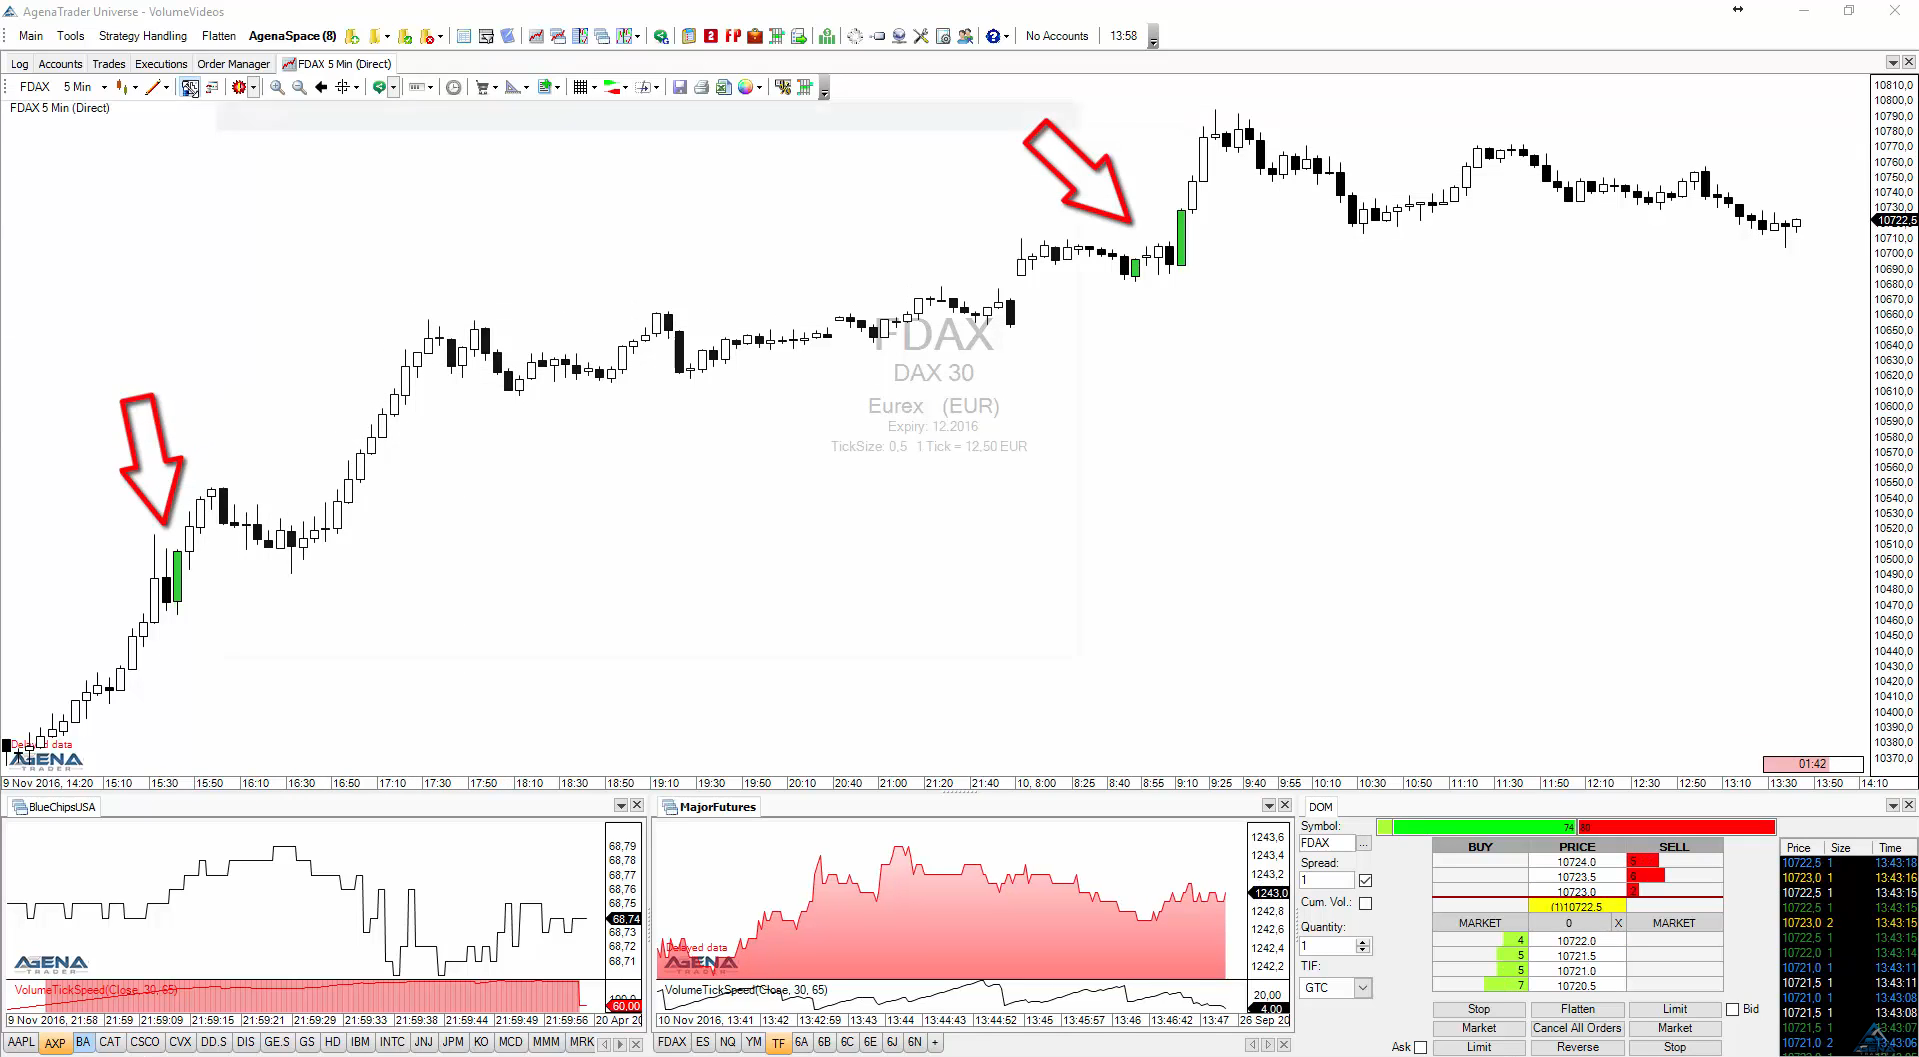
The indicator measures the number of ticks that are traded during a number of seconds defined by the user.
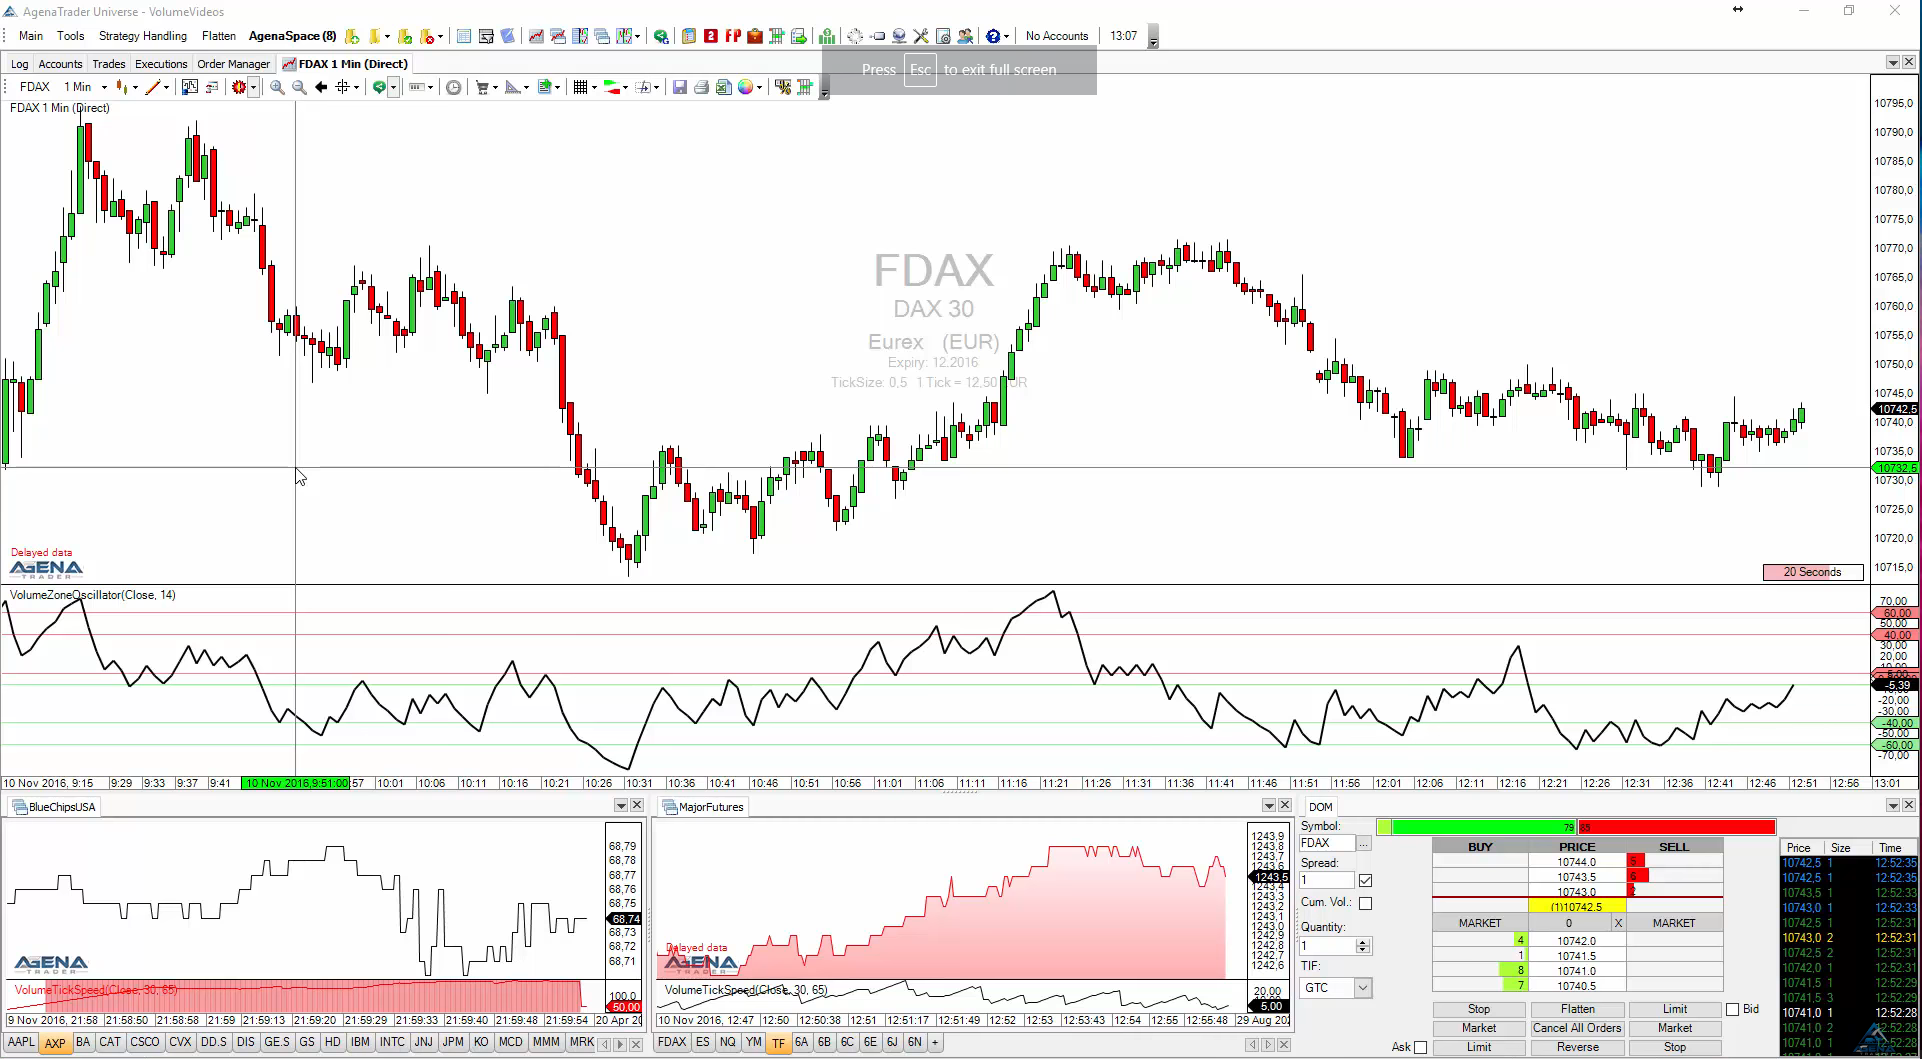
The VolumeZoneOscillator divides the volume activity into UpVolume and DownVolume, similarly to the VolumeUDR.
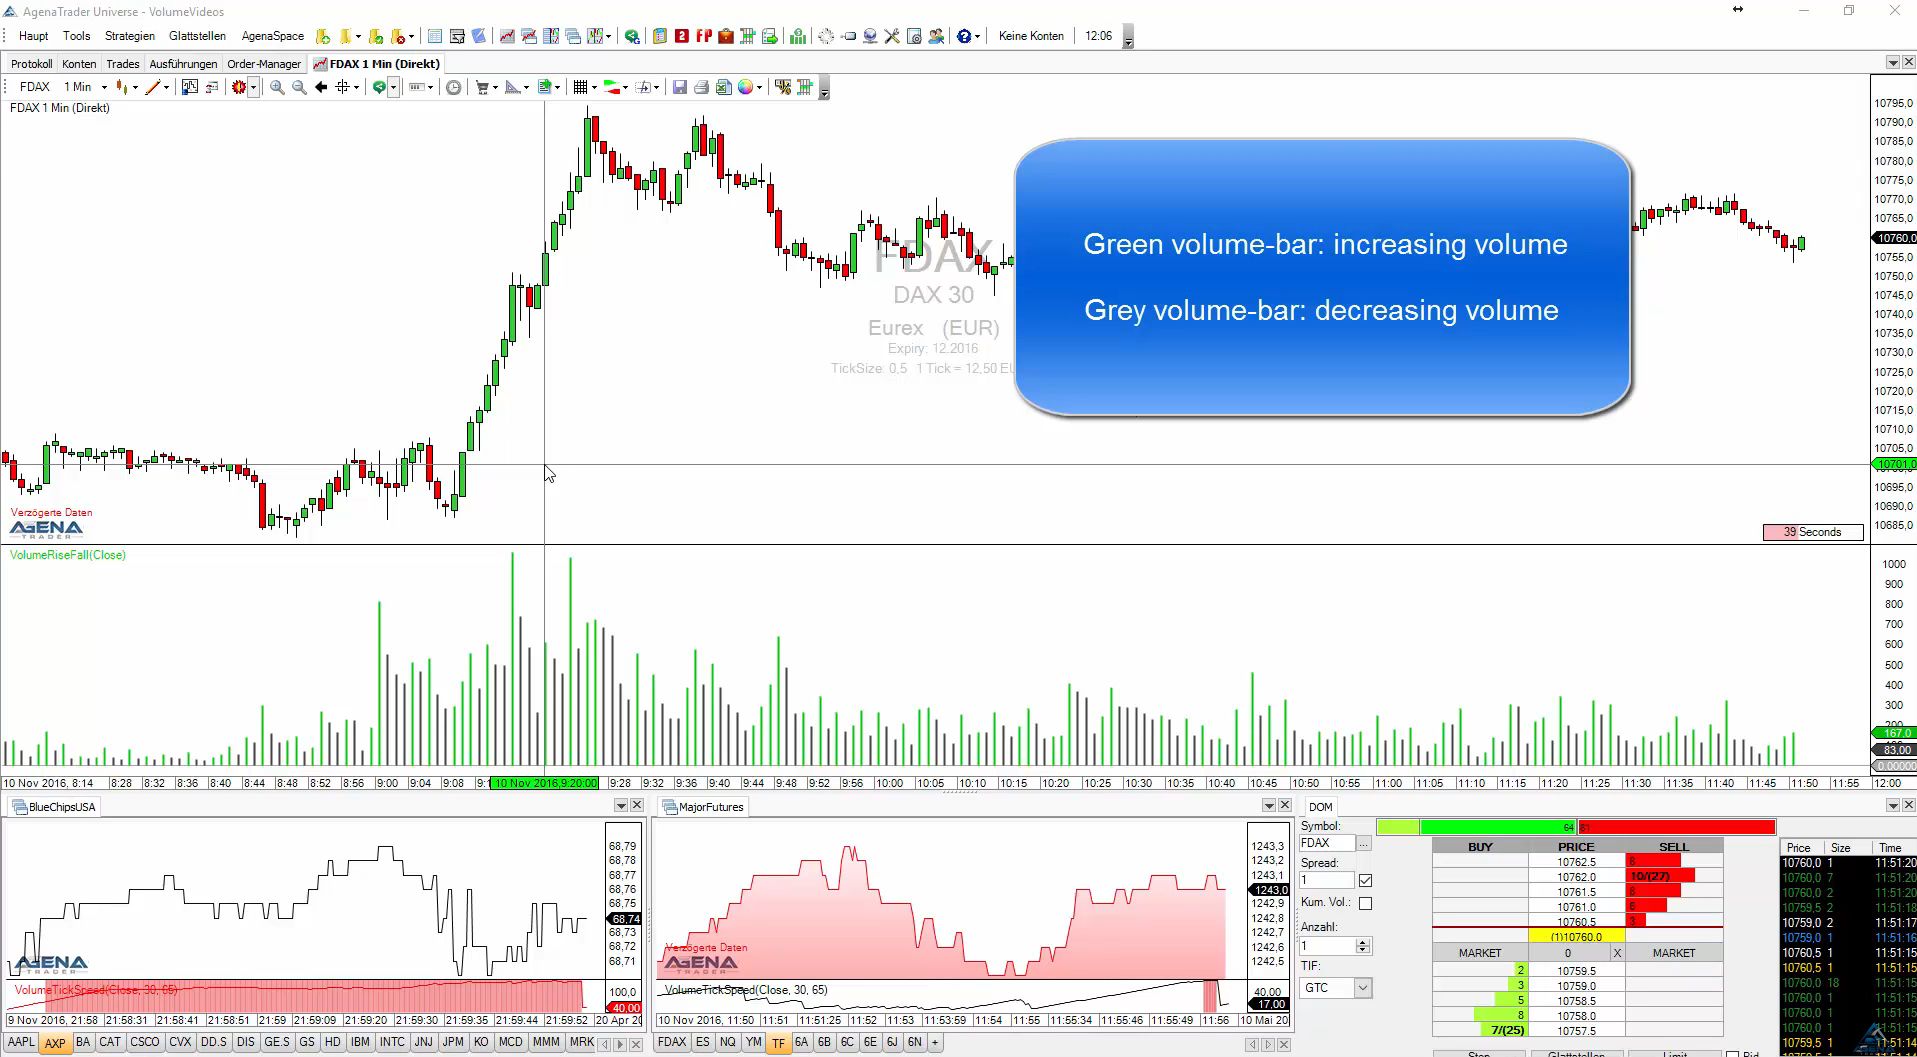
The VolumeRiseFall indicator is a normal volume display as volume bars, with, however, a different coloring than normal.
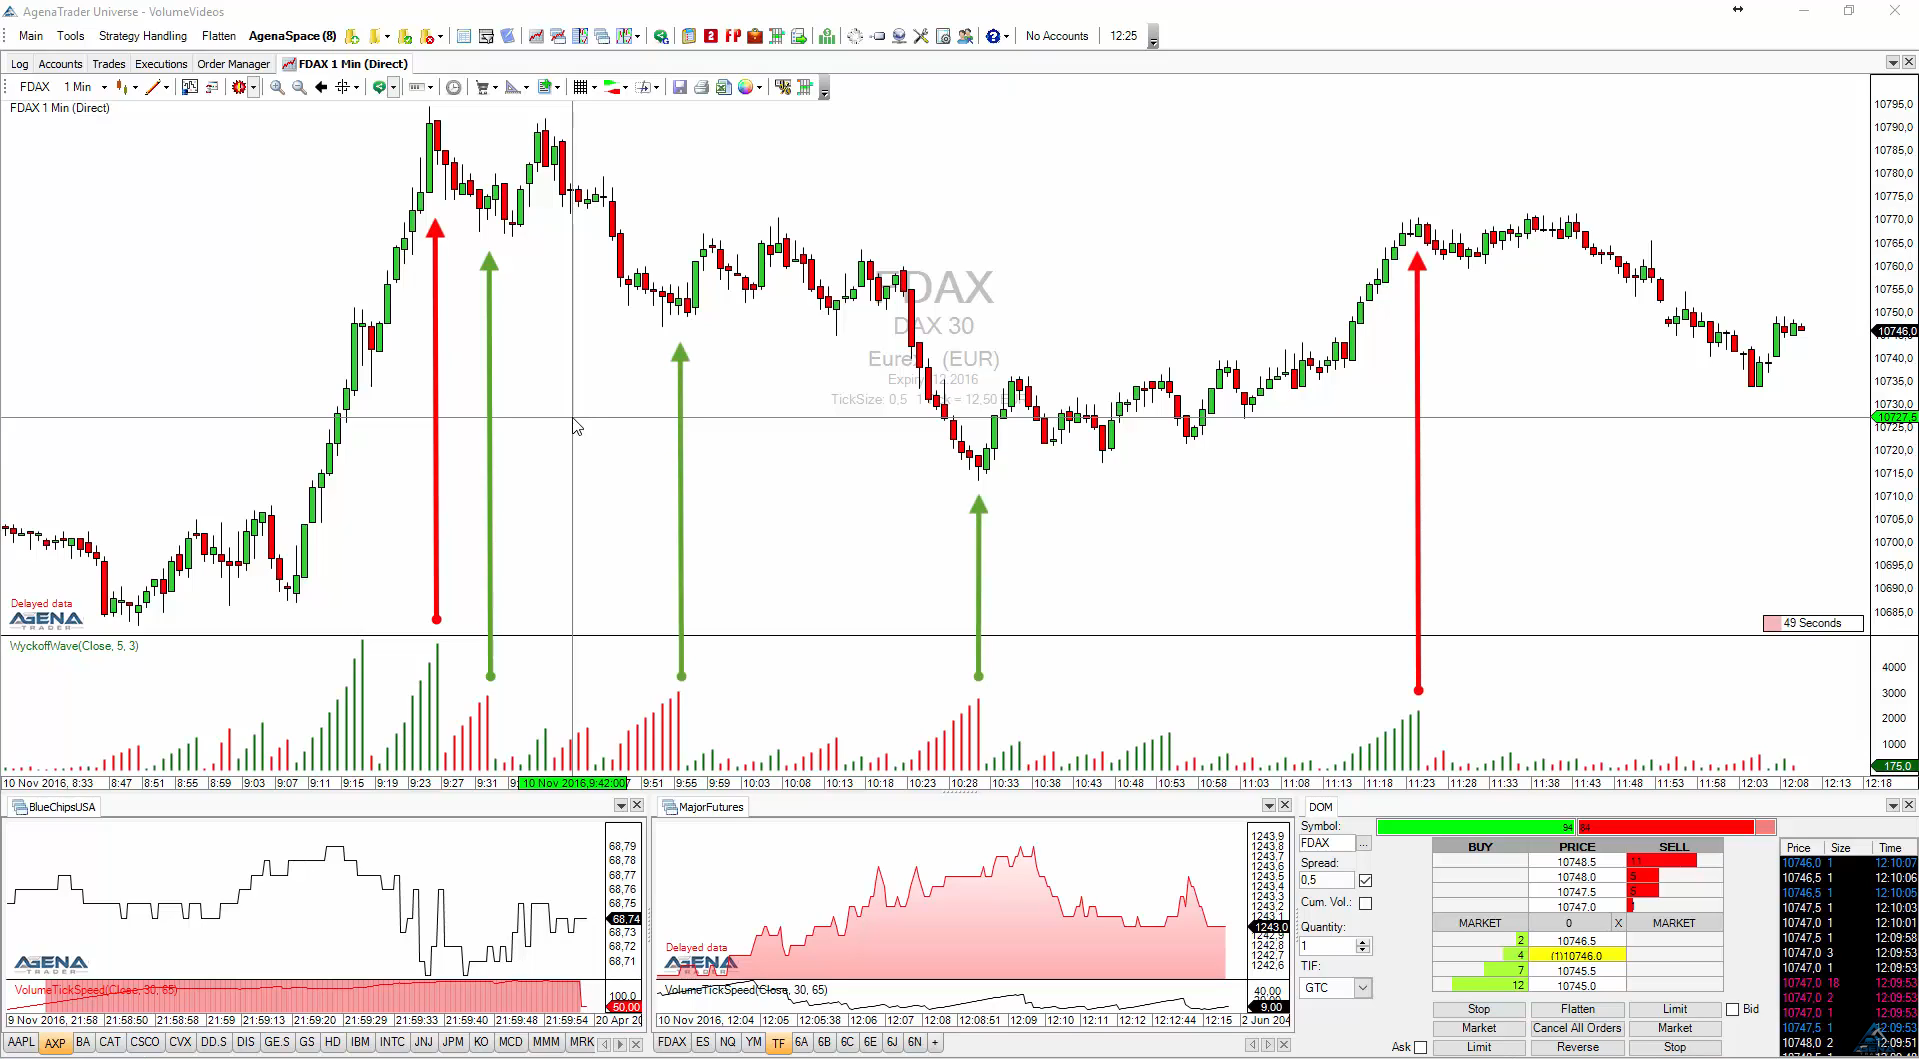
Adds the volume for each following bar until a price wave is over/finished.
You can set the sensitivity of the price waves. When the volume of a wave rises to particularly high values, is it very often because a turning point in the chart has been reached.
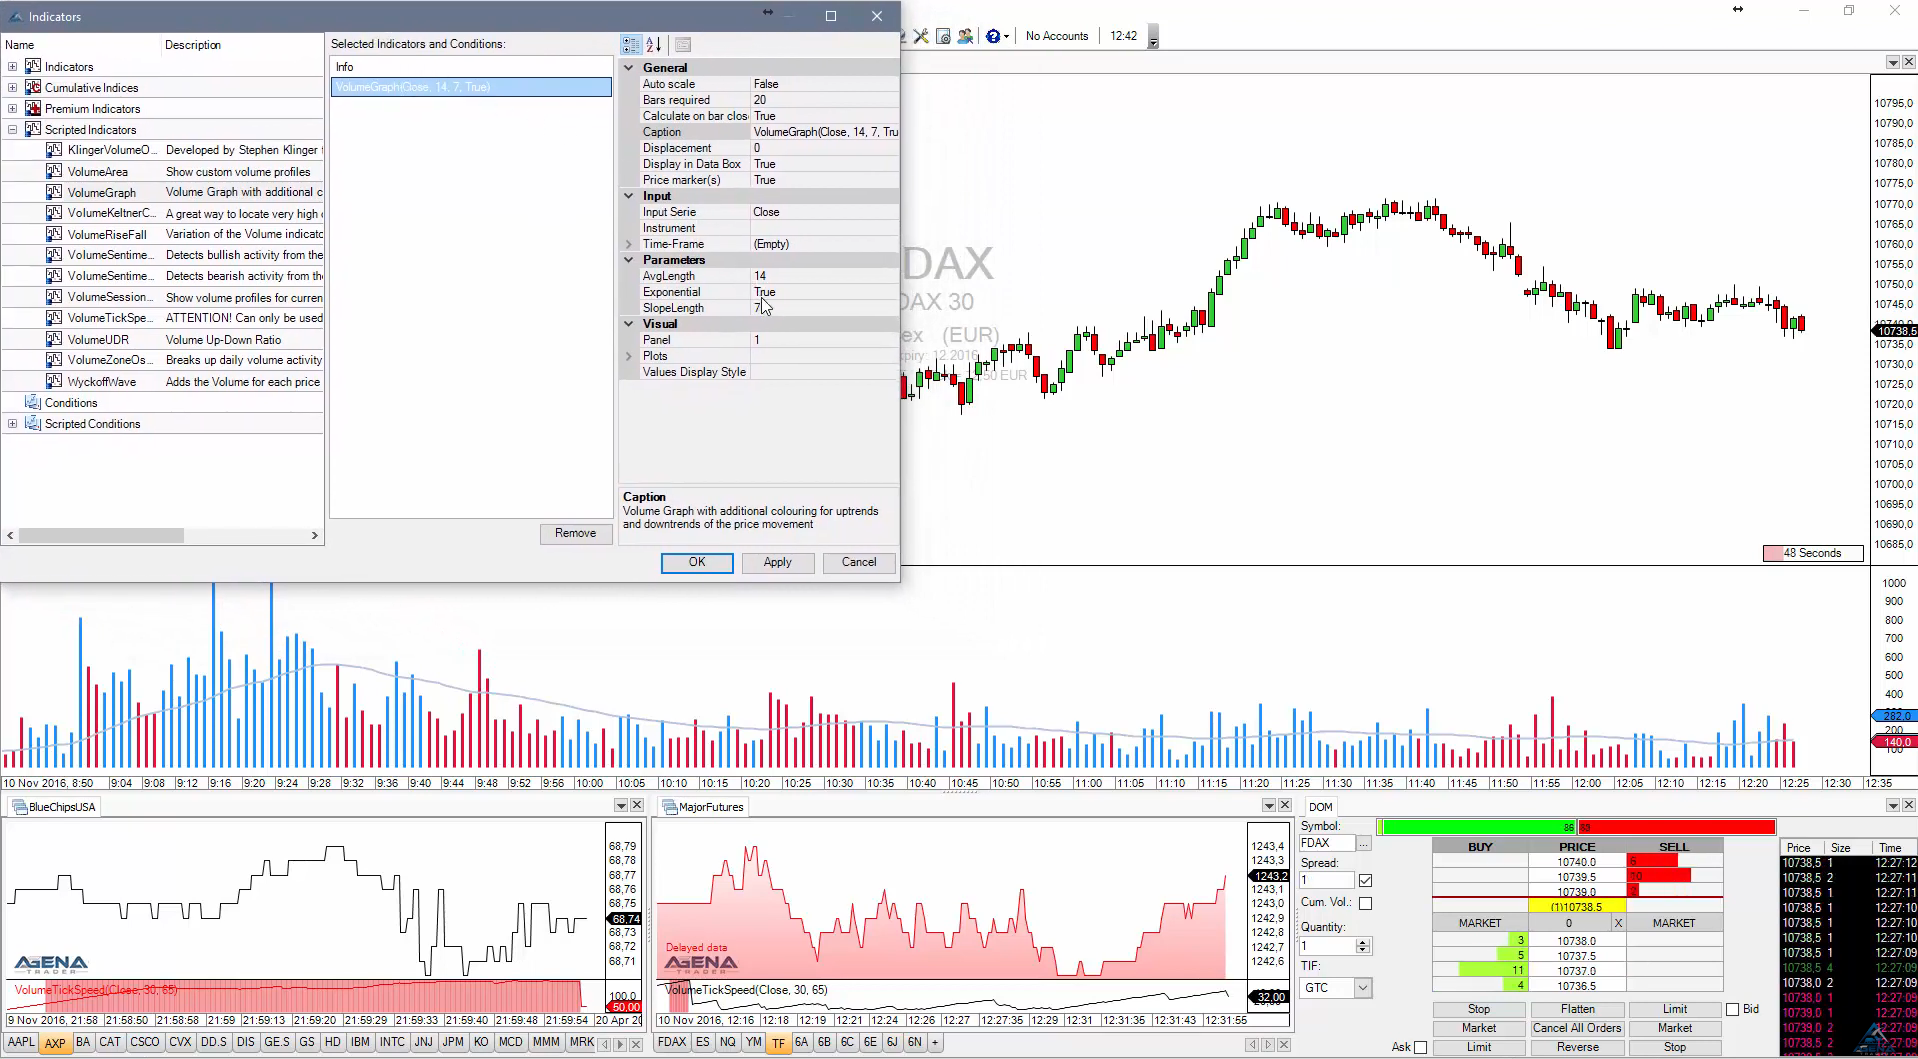
This indicator contains a normal volume histogram, but here, the coloring takes place based on price trends. The VolumeGraph determines short- or long-term price trends.
This indicator detects bullish volume activity based on the analysis of the volume of a period, the price span of a bar and the close of the bar (=VolumeSpreadAnalysis).
This indicator is the counterpart to the VolumeSentimentLong and detects bearish volume activity based on the analysis of the volume of a period, the price span of a bar and the close of the bar (=VolumeSpreadAnalysis).